How much risk are we carrying?
Estimate expected annual loss and tail exposure by scenario rather than compressing uncertainty into a single color or score.

Transparent Monte Carlo loss modeling for CISO–CFO decisions, control valuation, risk appetite, and security investment prioritization.
The decision problem
Heat maps can help organize a conversation, but they cannot tell a CISO, CFO, risk committee, or board what a bad year could cost, whether a proposed control changes that exposure, or which investment deserves priority.
Cyber risk quantification estimates the frequency and financial magnitude of cyber loss scenarios so leaders can compare exposure, risk appetite, control value, and security investments on a common economic basis.
Estimate expected annual loss and tail exposure by scenario rather than compressing uncertainty into a single color or score.
Model control counterfactuals, dependencies, annualized cost, loss avoided, net ROSI, and payback without pretending effects are additive.
Test every approved loss threshold and expose the evidence, owner, assumptions, and model limits behind the result.
Illustrative decision output
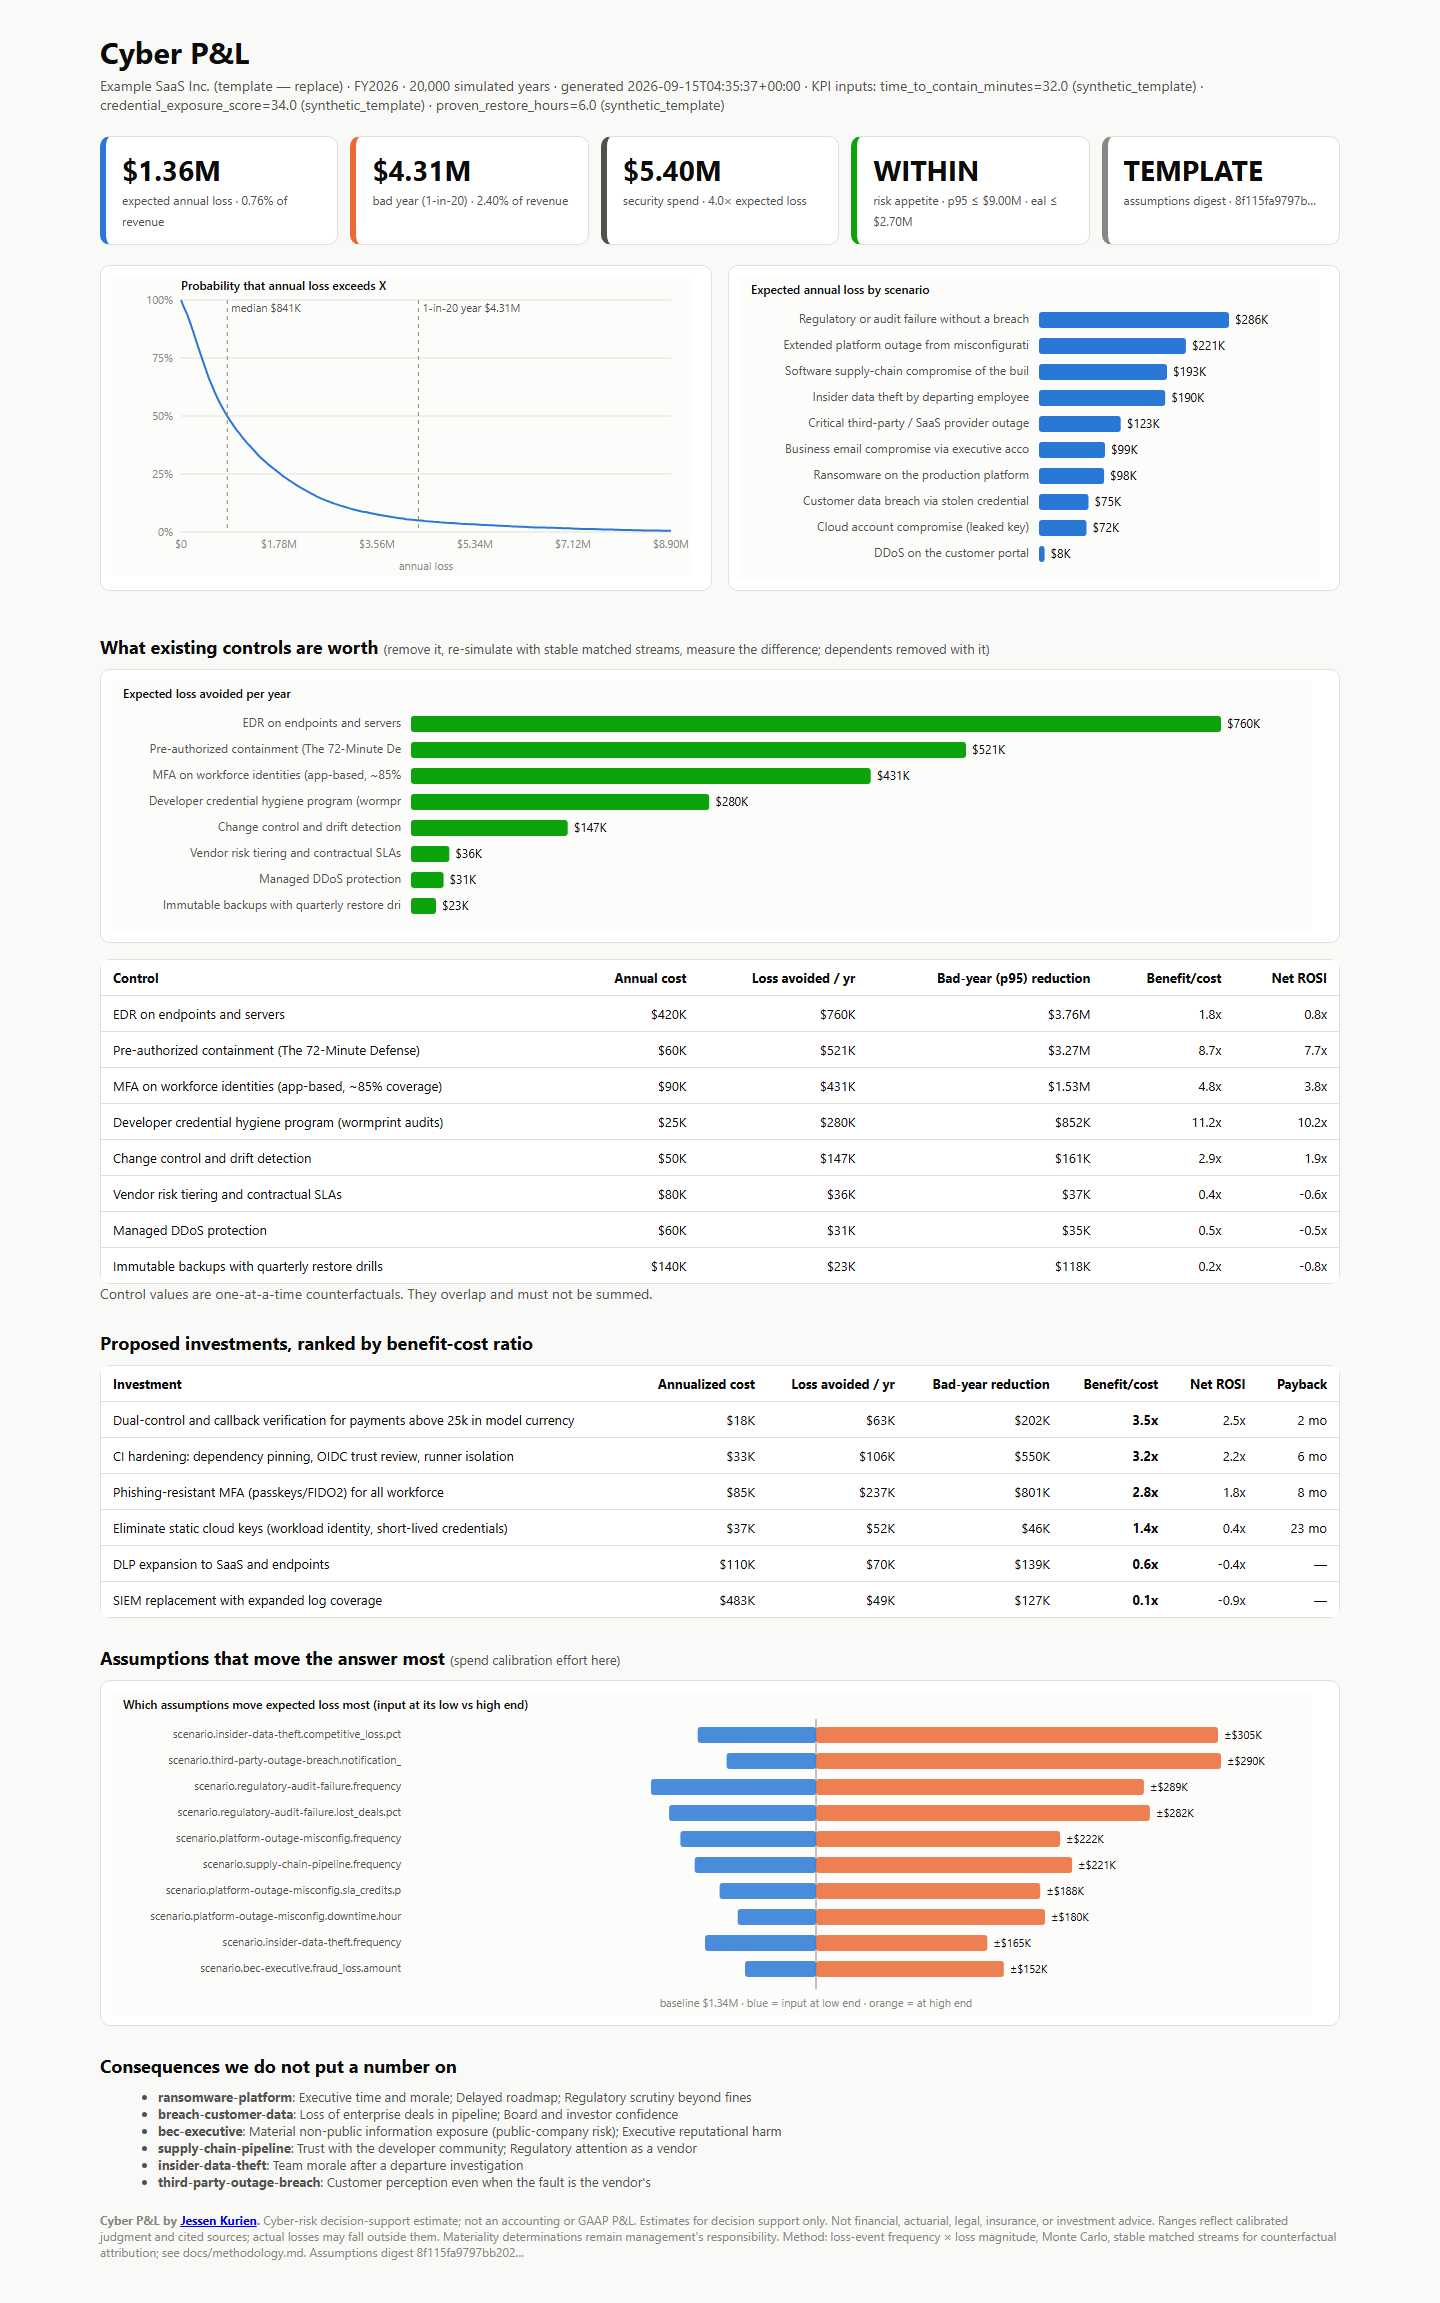
The bundled demonstration is a fictional $180M SaaS company. It shows how a governed model can place annual loss, bad-year exposure, appetite, and assumption status in one reviewable statement.
Every number below is an illustrative template—not a benchmark or forecast for another organization.
Assumption status remains incomplete until the required evidence and organization-specific attestations are supplied.
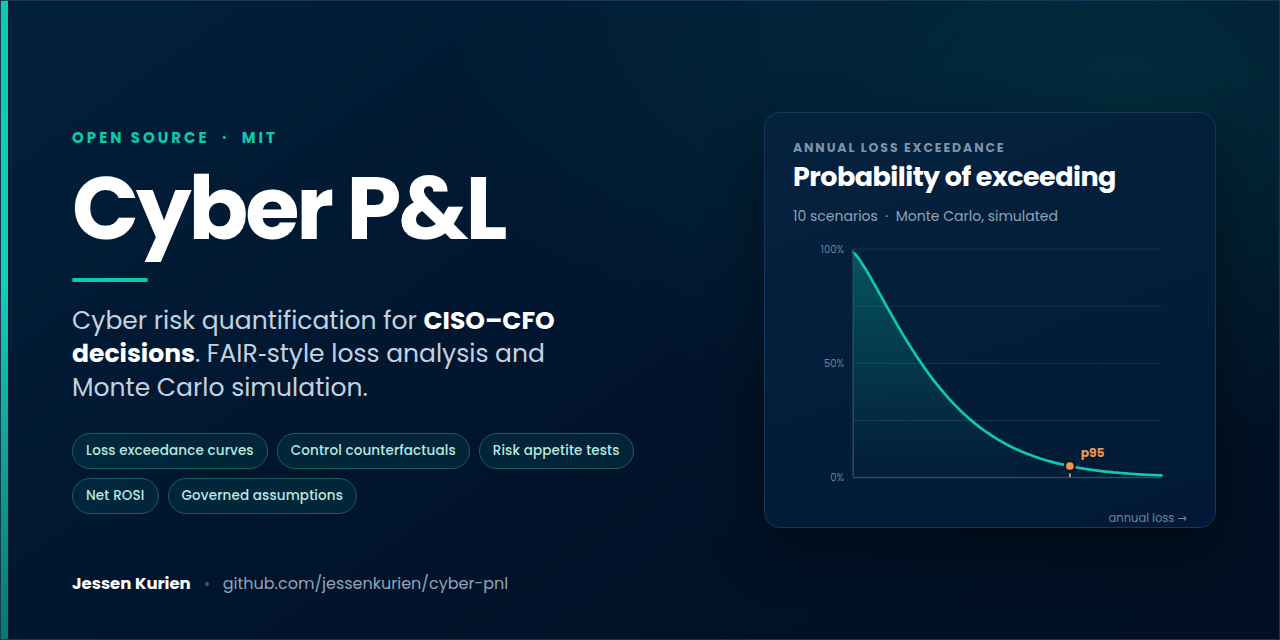
A loss exceedance curve shows the probability that annual cyber loss will exceed each financial threshold. Moving from left to right, the curve makes expected loss and tail exposure visible without reducing uncertainty to a single score.
Leaders can use the curve to compare modeled exposure with risk appetite and examine how a control or investment changes the distribution. The result remains decision support—not a forecast—and is only as reliable as the scenarios, evidence, ranges, and dependencies behind it.
Three practical use cases
Compare proposals using loss avoided, benefit-cost ratio, net ROSI, payback, and change in p95 exposure.
Translate technical scenarios into financial ranges, appetite tests, decision ownership, and documented model limitations.
Remove a control and its declared dependencies, then rerun the model with stable, independently seeded input streams.
How it works
Trust model
Apply the method
The software is free and open source. Advisory work helps an organization frame the right scenarios, calibrate credible inputs, govern assumptions, and turn the model into a decision process.
A brief conversation to identify the decision, audience, available evidence, and whether quantitative analysis is appropriate.
Discuss fitFrame one material decision, candidate loss scenarios, control choices, evidence gaps, owners, and the next defensible step.
Request a workshopBuild a prioritized model plan covering scenarios, evidence, governance, investment questions, validation criteria, and named owners.
Discuss an assessmentReview assumptions, risk appetite, control performance, investment choices, executive reporting, and changes in the threat or business environment.
Discuss advisory supportAbout the creator
Jessen Kurien is a cybersecurity leader, advisor, and author with 18+ years across MSSP operations, enterprise SOC leadership, incident response, detection engineering, security product development, GRC, and AI governance.
During nearly 15 years at Microsoft he was part of the founding team of the Microsoft Threat Intelligence Center (MSTIC), contributed early detections to Microsoft Sentinel, and led a detection engineering team in Microsoft Defender XDR. He also conducted ISO/IEC 27001 audits, and has built and run security operations from both sides of the relationship—as the provider and as the enterprise.
He holds CISM, CISA, and the ISO/IEC 42001 Lead Implementer credential, and advises CISOs and security leaders on cyber defense, SIEM/XDR strategy, incident response, cyber risk, and Artificial Intelligence Management Systems.
Frequently asked questions
Cyber P&L is an open-source Python project that uses FAIR-style loss analysis and Monte Carlo simulation to support cyber risk, control, appetite, and security-investment decisions.
No. It is not an accounting or GAAP profit-and-loss statement, actuarial model, insurance model, forecast, or substitute for professional financial, legal, or investment advice.
It expresses cyber scenarios using financial ranges, tail exposure, risk appetite, control economics, evidence ownership, and explicit model limits instead of relying only on technical scores.
It uses a FAIR-style loss-event frequency and loss-magnitude approach. It is not affiliated with, certified by, or endorsed by The Open Group and does not claim Open FAIR conformance.
No. The bundled company, costs, controls, measurements, and results are fictional. Organizations must replace them with scoped evidence, accountable owners, review, and required attestations.
A fixed-scope engagement can produce a decision statement, prioritized scenarios, an evidence and assumption register, risk-appetite tests, control/investment comparisons, validation criteria, and named owners.
Start with the open-source model, or discuss a bounded assessment for a security investment, control, risk-appetite, or board-reporting decision.